
Using the Analytics Dashboard
The Analytics dashboard gives you a comprehensive view of your coaching program's performance and individual client progress. As a coach, you'll see program-wide metrics and KPIs, while your clients can access their own analytics tab to track their personal accountability and progress.
This feature is currently in beta. We welcome your feedback on which metrics, KPIs, or charts would be most valuable for your coaching practice.
Accessing the Analytics Dashboard
Navigate to the Analytics section from your top navigation menu. When you first open Analytics, you'll see your program's overall performance metrics.
Filtering Your Data
Use the filters at the top of the dashboard to narrow down your analytics view:
Filter by Assignee
Select which team members' clients to include in the analytics. You can choose All Members or filter by specific coaches or team members.

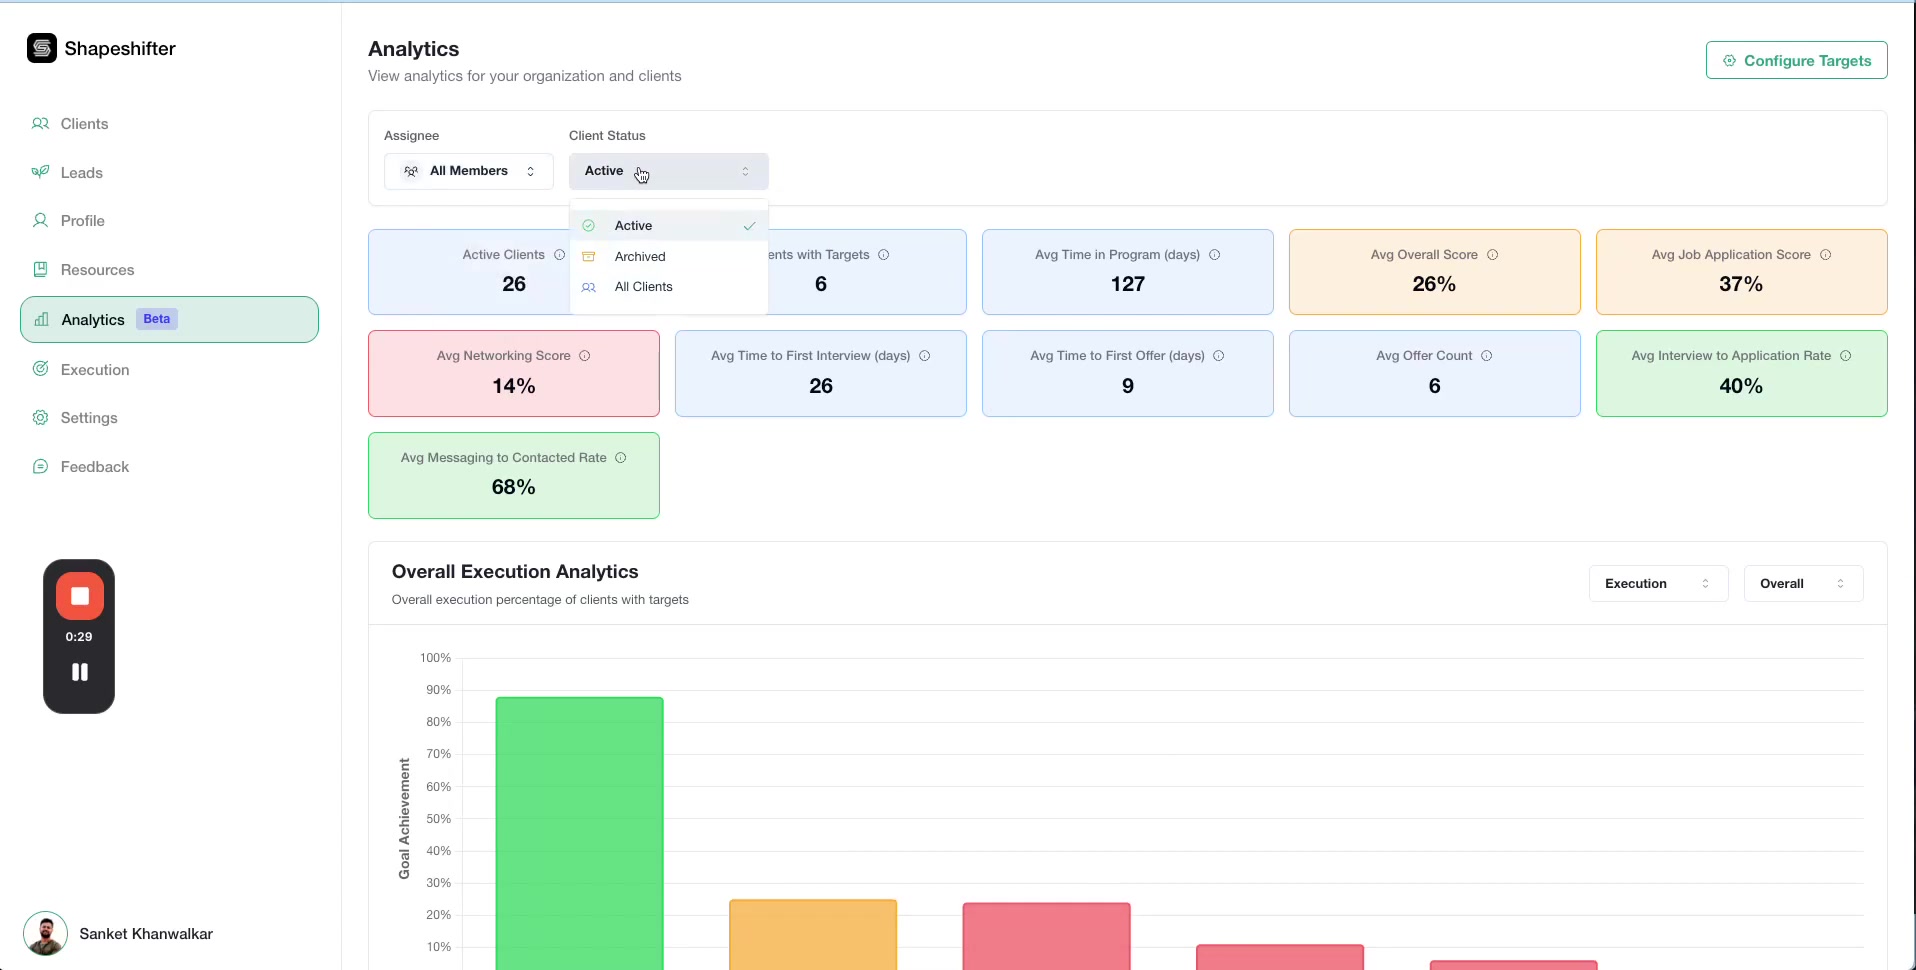
Filter by Client Status
Choose to view analytics for:
Active clients only
Archived clients
All Clients in your program
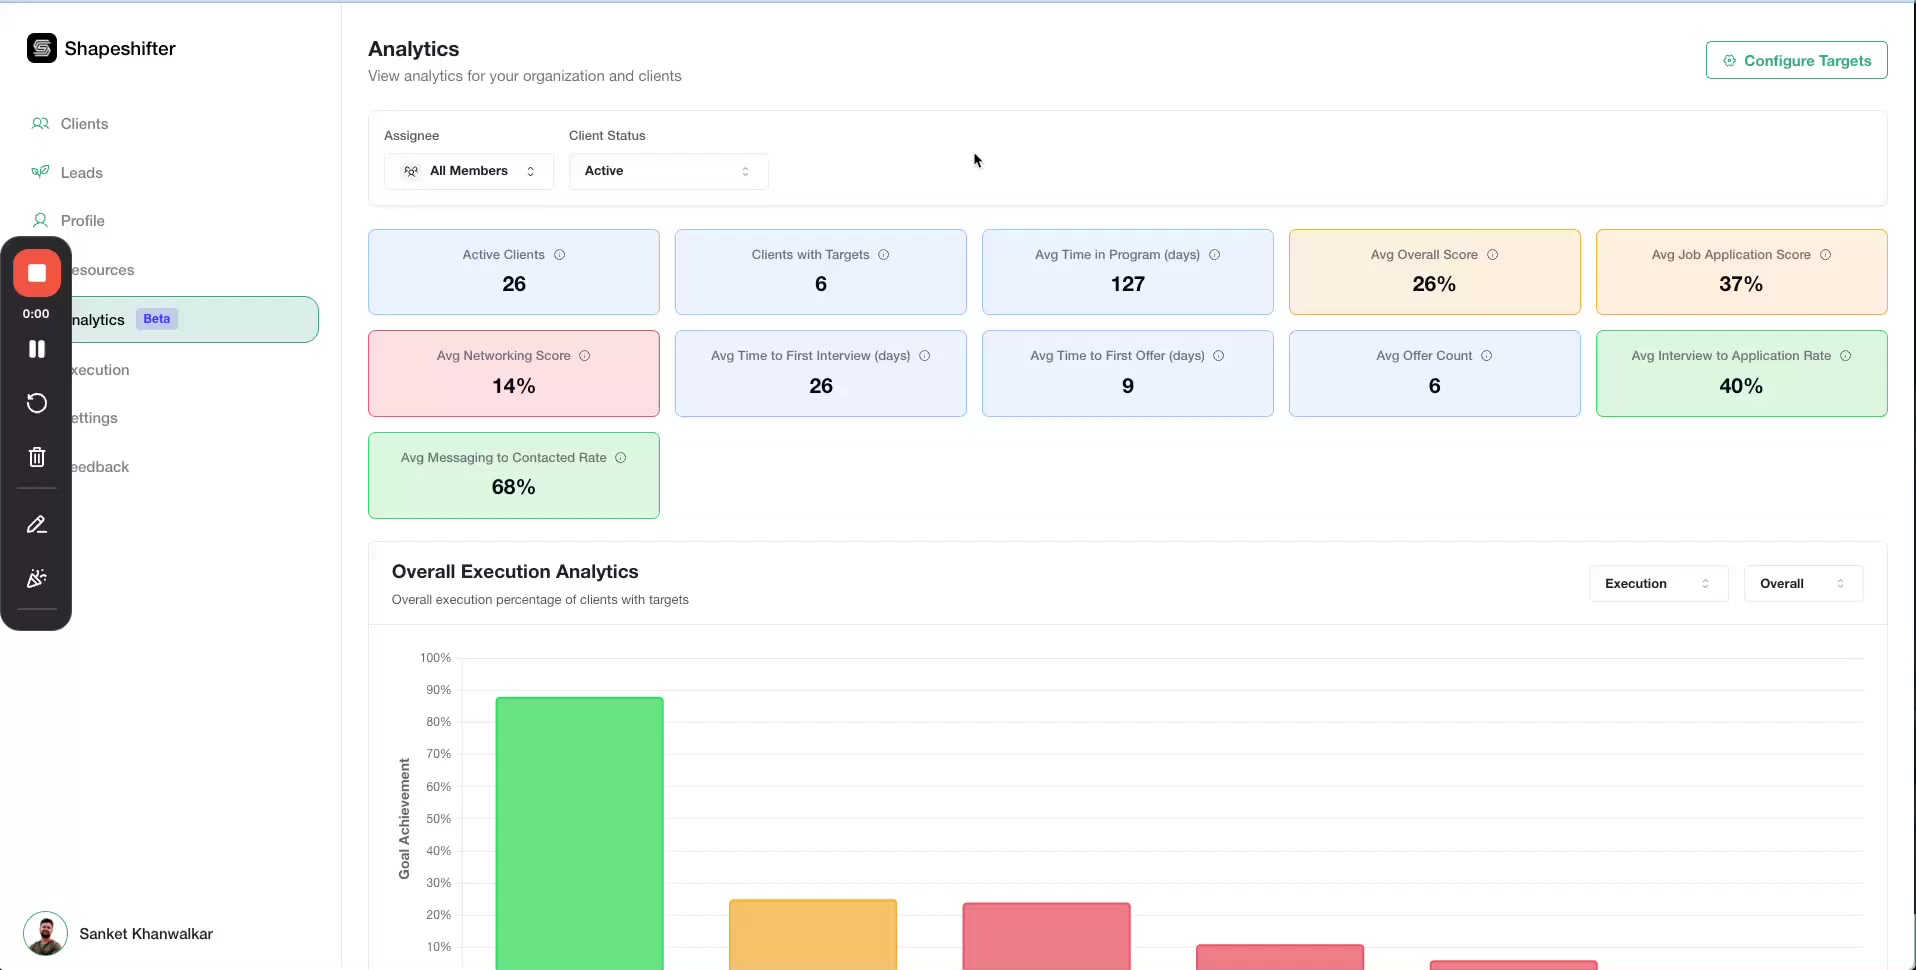
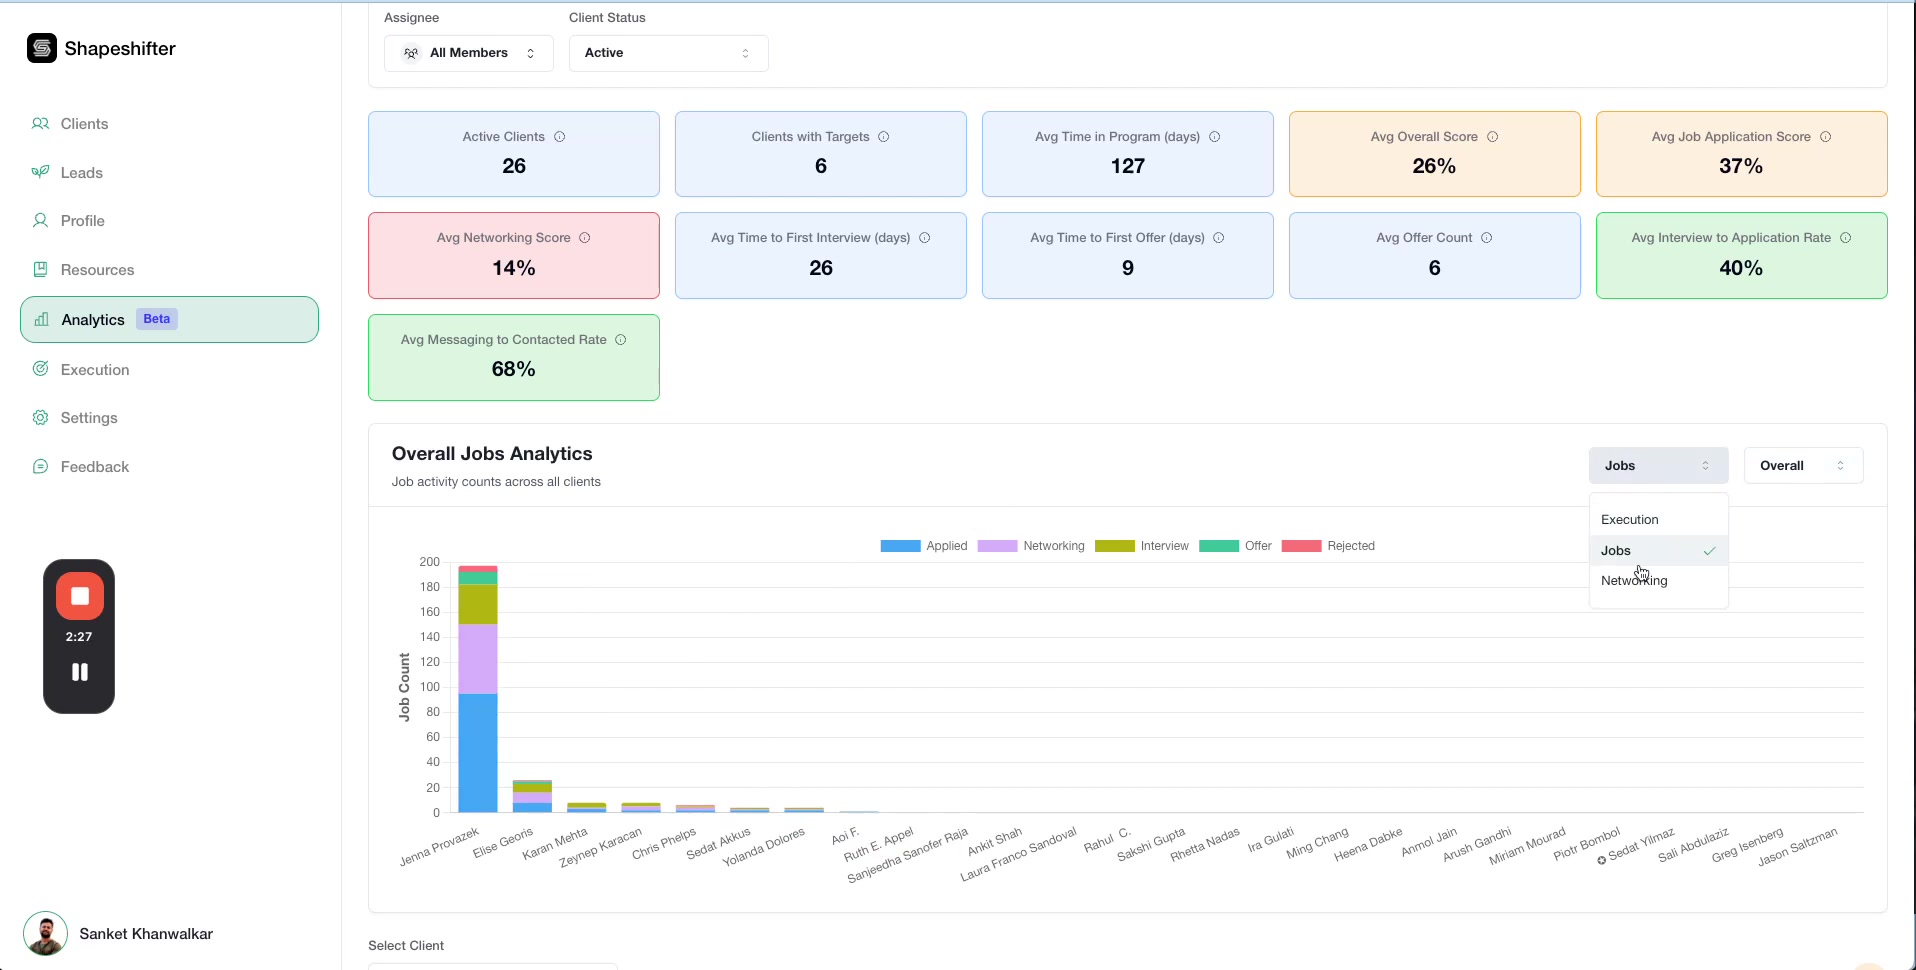
Understanding Program-Wide KPIs
The dashboard displays key performance indicators that give you a snapshot of your entire coaching program:
Active Clients: Total number of currently active clients
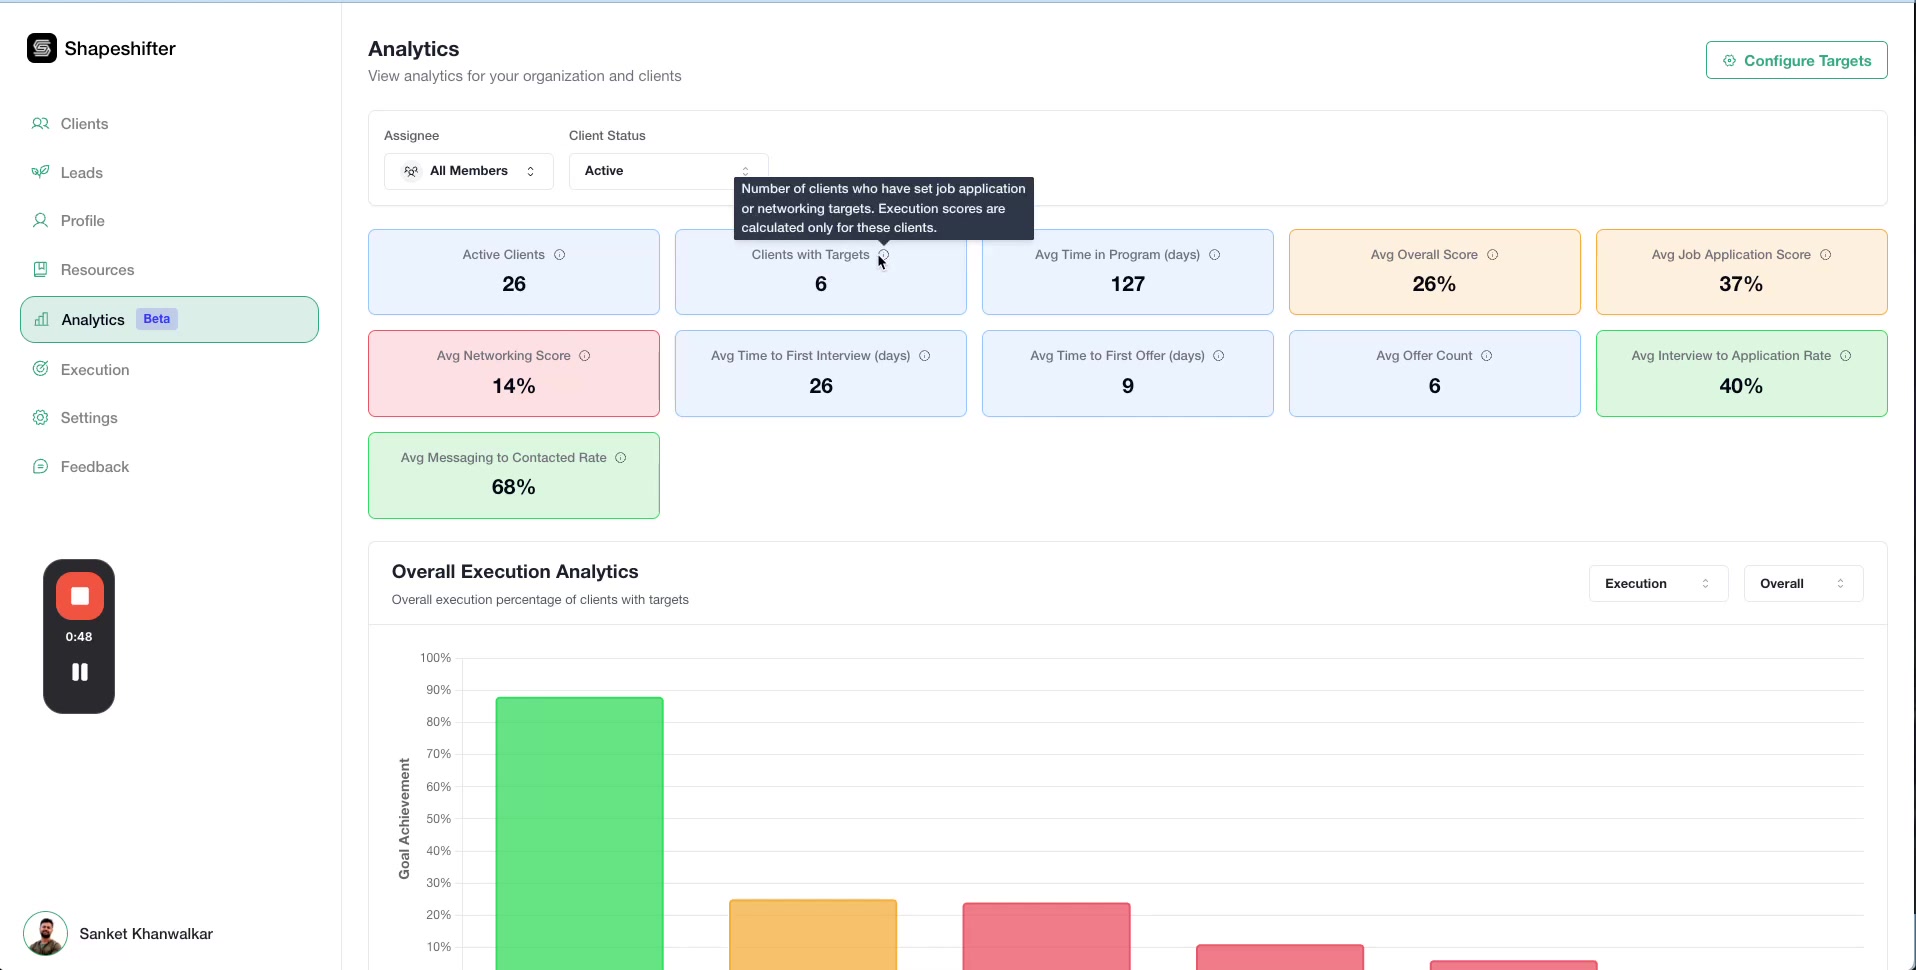
Clients with Targets: Clients who have execution data (networking, applications, job targets set)
Avg Time in Program: Average duration clients have been in your program
Avg Overall Score: Average execution performance across all clients
Avg Job Application Score: Average performance on job application activities
Avg Networking Score: Average performance on networking activities
Avg Time to First Interview: How long it typically takes clients to land their first interview
Avg Time to First Offer: How long it typically takes clients to receive their first job offer
Avg Offer Count: Average number of offers clients receive
Interview to Application Rate: Percentage of applications that result in interviews
Messaging to Contacted Rate: Percentage of contacts that result in ongoing messaging
Hover over any metric label to see a tooltip with more details about how it's calculated.
Exploring Visual Analytics
The dashboard includes interactive bar charts that help you quickly identify trends and areas needing attention.
Overall Execution Analytics
This chart shows execution scores for all clients. Hover over any bar to see detailed progress information for that client, including their current stage and specific metrics.
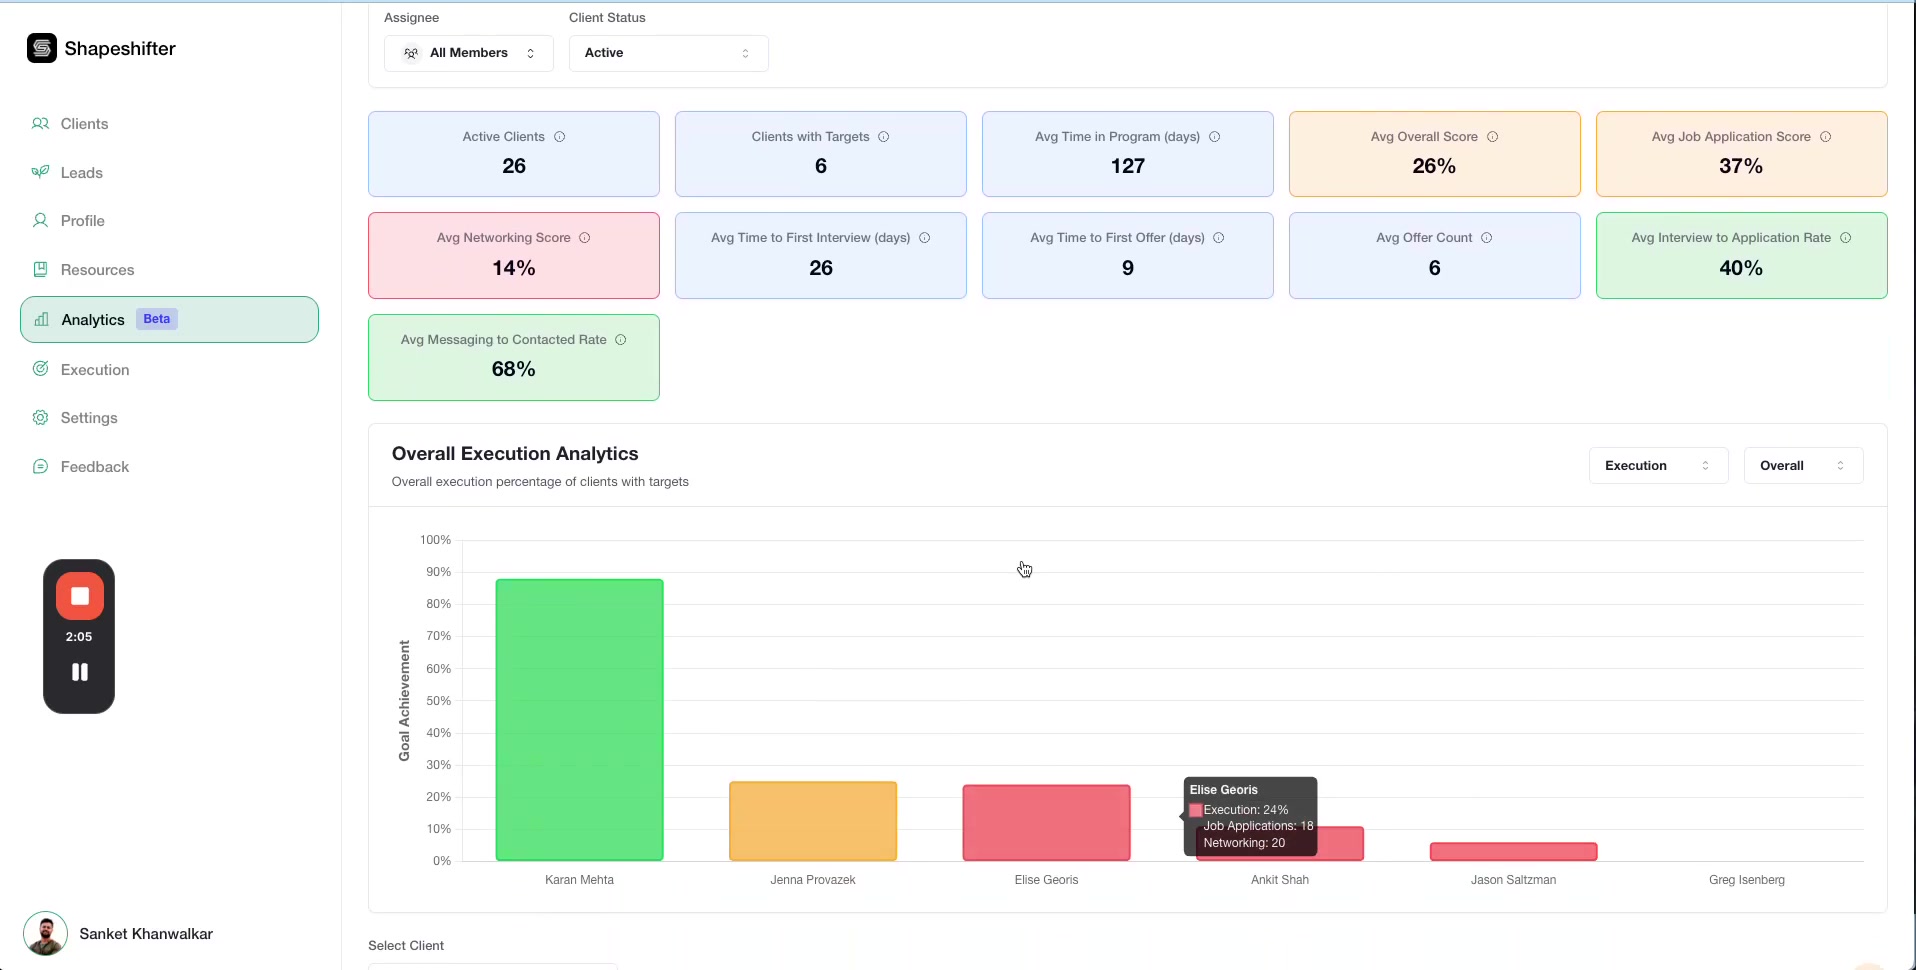
Use these charts to quickly identify "gray areas" where clients might be stuck or not making progress.
Jobs Analytics
Switch to the Jobs view using the dropdown selector to see how clients are progressing through the job application process. Each bar is segmented to show:
Applied: Jobs applied to
Networking: Jobs where networking is in progress
Interview: Jobs at interview stage
Offer: Jobs with offers received
Rejected: Applications that were rejected

Networking Analytics
The Networking view breaks down networking activities into stages:
Contacted: Initial contacts made
Messaging: Active conversations
Stuck: Networking efforts that have stalled
Completed: Networking goals achieved
Closed: Networking efforts concluded
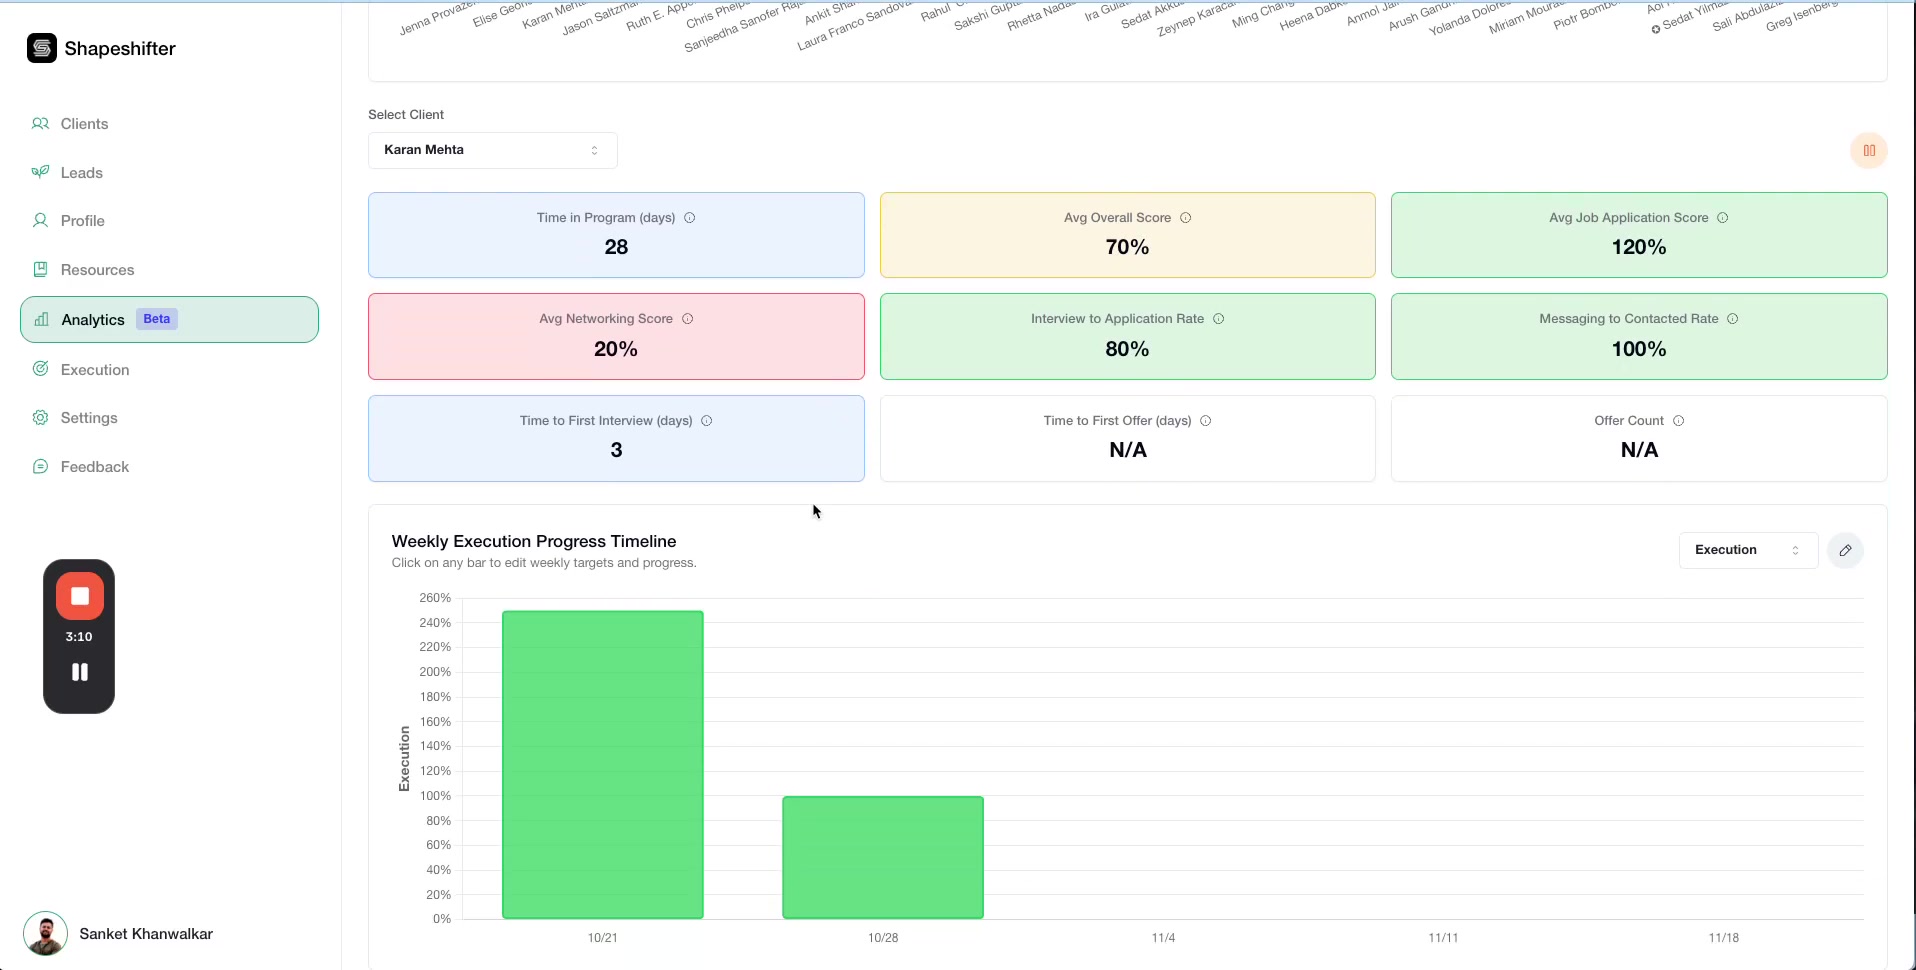
Viewing Individual Client Analytics
To dive deeper into a specific client's performance, use the Select Client dropdown at the top of the dashboard. Once you select a client, you'll see their individual metrics and performance indicators.

Weekly Execution Progress Timeline
Track how a client's execution score has changed over time with the weekly progress timeline. This helps you identify week-over-week trends and see if your coaching interventions are working.
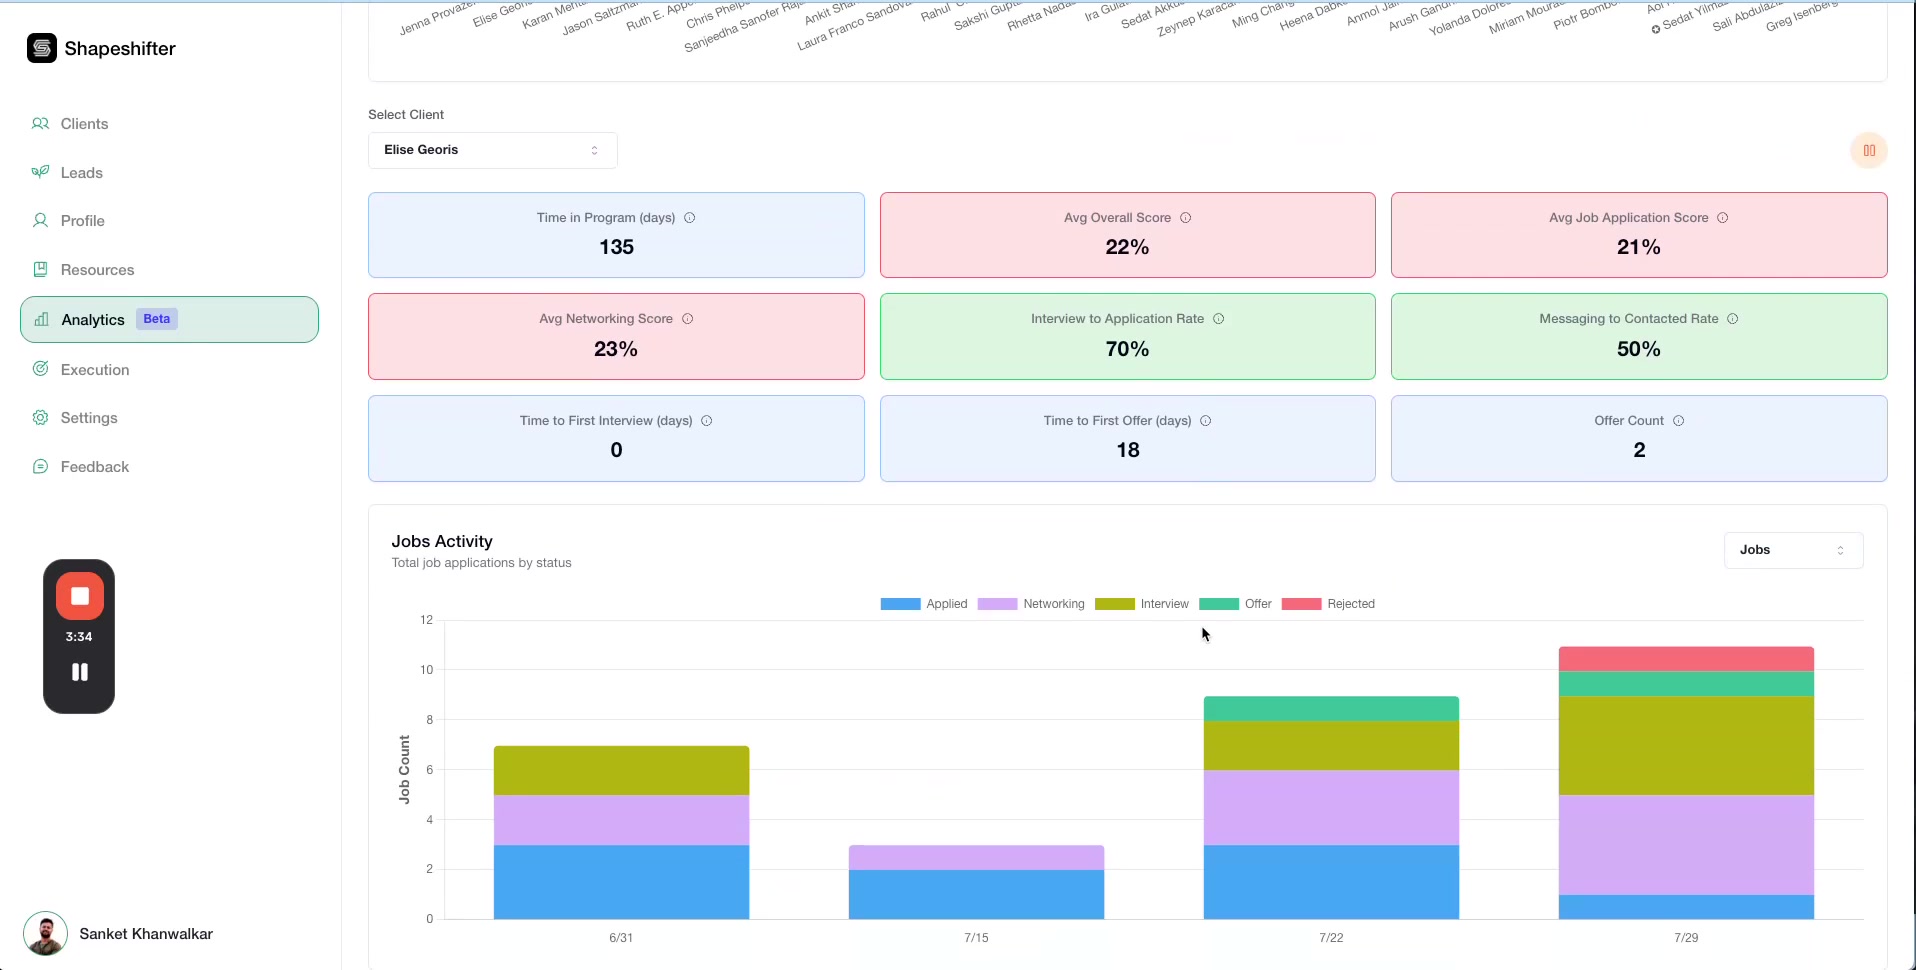
Jobs Activity Over Time
See how many jobs a client has been working on each week and how their job search activity has evolved throughout your coaching engagement.
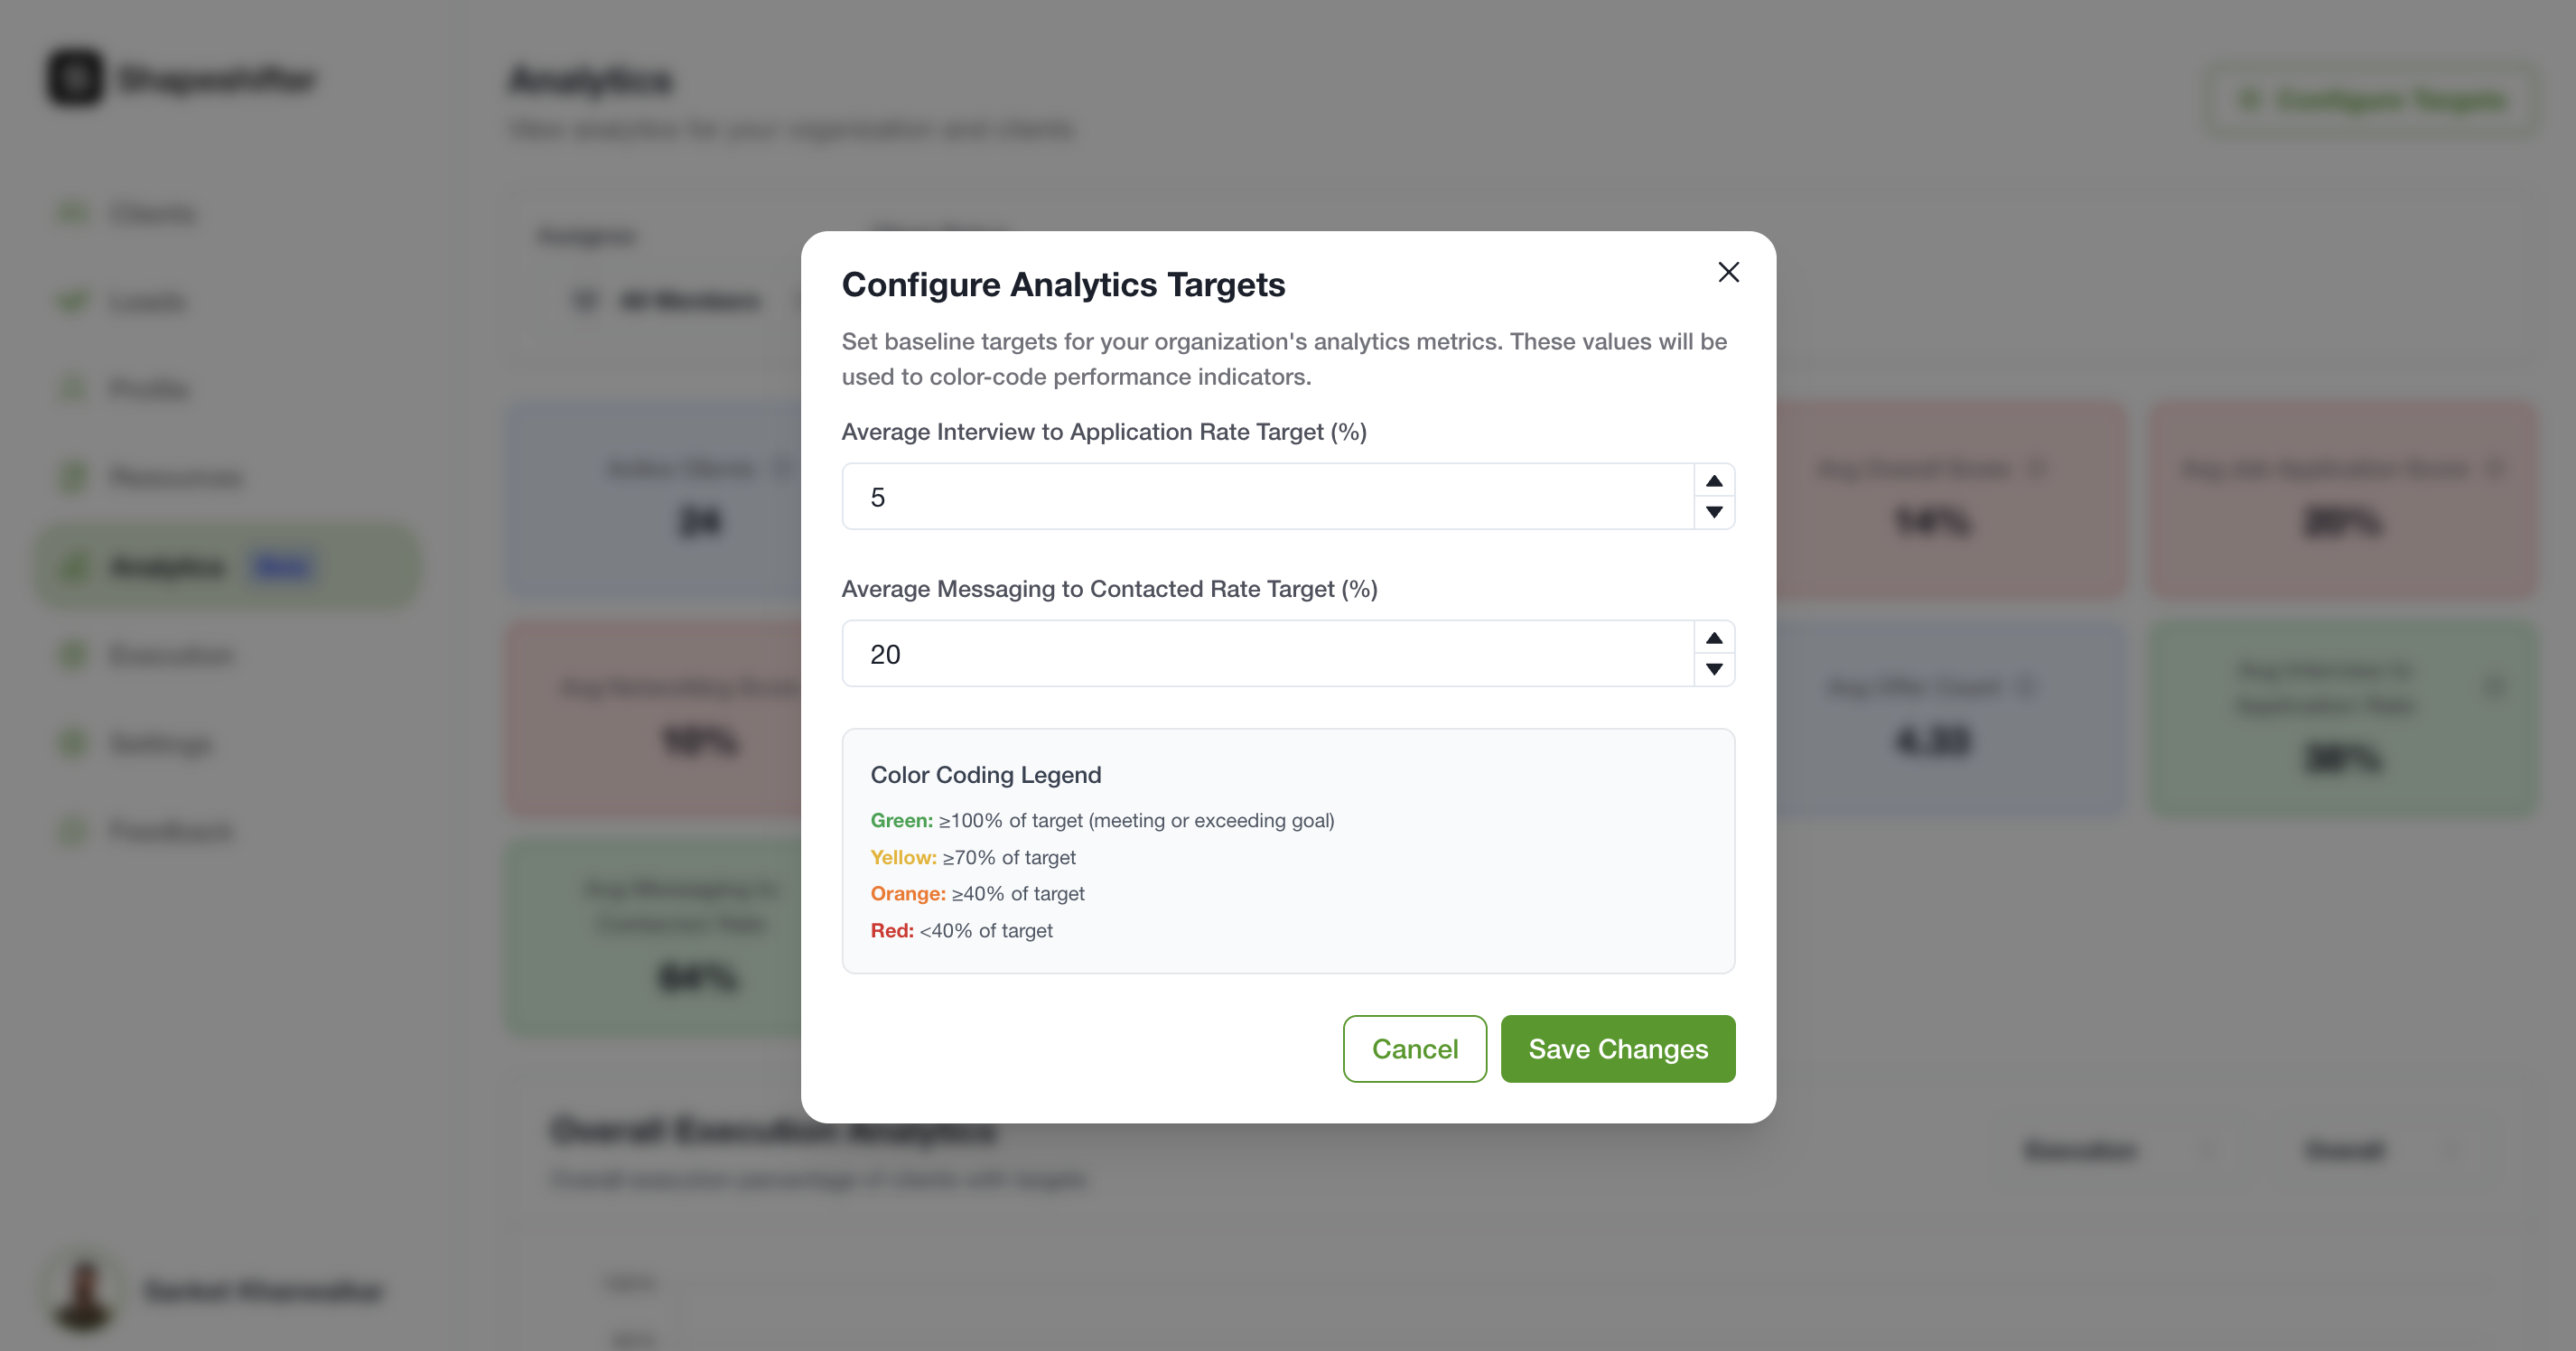
Configuring Analytics Targets
Customize what constitutes good performance in your program by setting analytics targets and color coding thresholds.
Click Configure Analytics Targets to open the configuration modal where you can set:
Average Interview to Application Rate Target (%): The benchmark percentage for how many applications should result in interviews
Average Messaging to Contacted Rate Target (%): The benchmark percentage for how many contacts should result in ongoing conversations
Color Coding Legend: Define what Green, Yellow, Orange, and Red performance levels mean in your program
Client-Side Analytics [Coming Soon]
Once the beta testing is complete, coaches will have the option to enable this to clients to see their own individual performance
Tips for Using Analytics Effectively
Identify stuck clients quickly: Use the visual charts to spot clients with lots of "gray areas" or stalled progress
Track week-over-week trends: The timeline charts help you see if coaching interventions are working
Use metrics to improve your program: Program-wide averages show you what's working across all clients and where you might need to adjust your coaching approach
Share feedback: This is a beta feature, so let us know which additional metrics, KPIs, or charts would help you run your coaching practice more effectively
Video Walkthrough
Watch the complete demonstration of the Analytics dashboard: